import { aq, op } from "@uwdata/arquero"

bucket_base = "https://d33173dkfxwa5x.cloudfront.net/www/"

FA = FileAttachment
import {aq as aq, op as op} from "@uwdata/arquero"
bucket_base = "https://d33173dkfxwa5x.cloudfront.net/www/"
FA = ƒ(name)
import { aq, op } from "@uwdata/arquero"
bucket_base = "https://d33173dkfxwa5x.cloudfront.net/www/"
FA = FileAttachment import {aq as aq, op as op} from "@uwdata/arquero"
Is it hot in Mount Gambier right now?
answers = ({
  "Hell no!":   {color: "white",   fill1: "#5287d1", fill2: "#2166ac" },
  "No!":        {color: "white",   fill1: "#a2cdeb", fill2: "#67a9cf" },
  "Nope":       {color: "#333333", fill1: "#f5f8fa", fill2: "#d1e5f0" },
  "Not really": {color: "#333333", fill1: "#f7f7f7", fill2: "#ebebeb" },
  "Yup":        {color: "#333333", fill1: "#fddcca", fill2: "#f7cfb7" },
  "Yeah!":      {color: "white",   fill1: "#de7b49", fill2: "#fc946a" },
  "Hell yeah!": {color: "white",   fill1: "#d1231d", fill2: "#b2182b" }
})

html`
<div class="answer-icon-and-label">
  <span class="answer-icon" style="background-color: ${answers[statsPlace.isit_answer].fill2};">
  </span>
  <span>${statsPlace.isit_answer}</span>
</div>`md`${statsPlace.isit_comment}`It's actually really cold
datefns = import("https://cdn.skypack.dev/date-fns@3.3.1?min")
tmaxWhen = new Date(Date.parse(statsPlace.isit_maximum_dt || null))
tminWhen = new Date(Date.parse(statsPlace.isit_minimum_dt || null))

tmaxWhenFriendly = isFinite(tmaxWhen) ?
  datefns.formatRelative(tmaxWhen, new Date()) : ""
tminWhenFriendly = isFinite(tminWhen) ?
  datefns.formatRelative(tminWhen, new Date()) : ""

percentRating = statsPlace.isit_average.toFixed(1) + "%"
md`${statsPlace.isit_minimum} °C `0.4 °C
md`${tminWhenFriendly}`yesterday at 9:00 PM
md`${statsPlace.isit_maximum} °C `13.7 °C
md`${tmaxWhenFriendly}`today at 3:43 AM
html`
<div class="answer-icon-and-label">
  <span class="answer-icon" style="background-color: ${answers[statsPlace.isit_answer].fill2};"></span>
  <span>${statsPlace.isit_current.toFixed(1)} °C</span>
</div>`md`Average so far<br>hotter than **${percentRating}** of days for this time of year.`Average so far
hotter than 10.3% of days for this time of year.
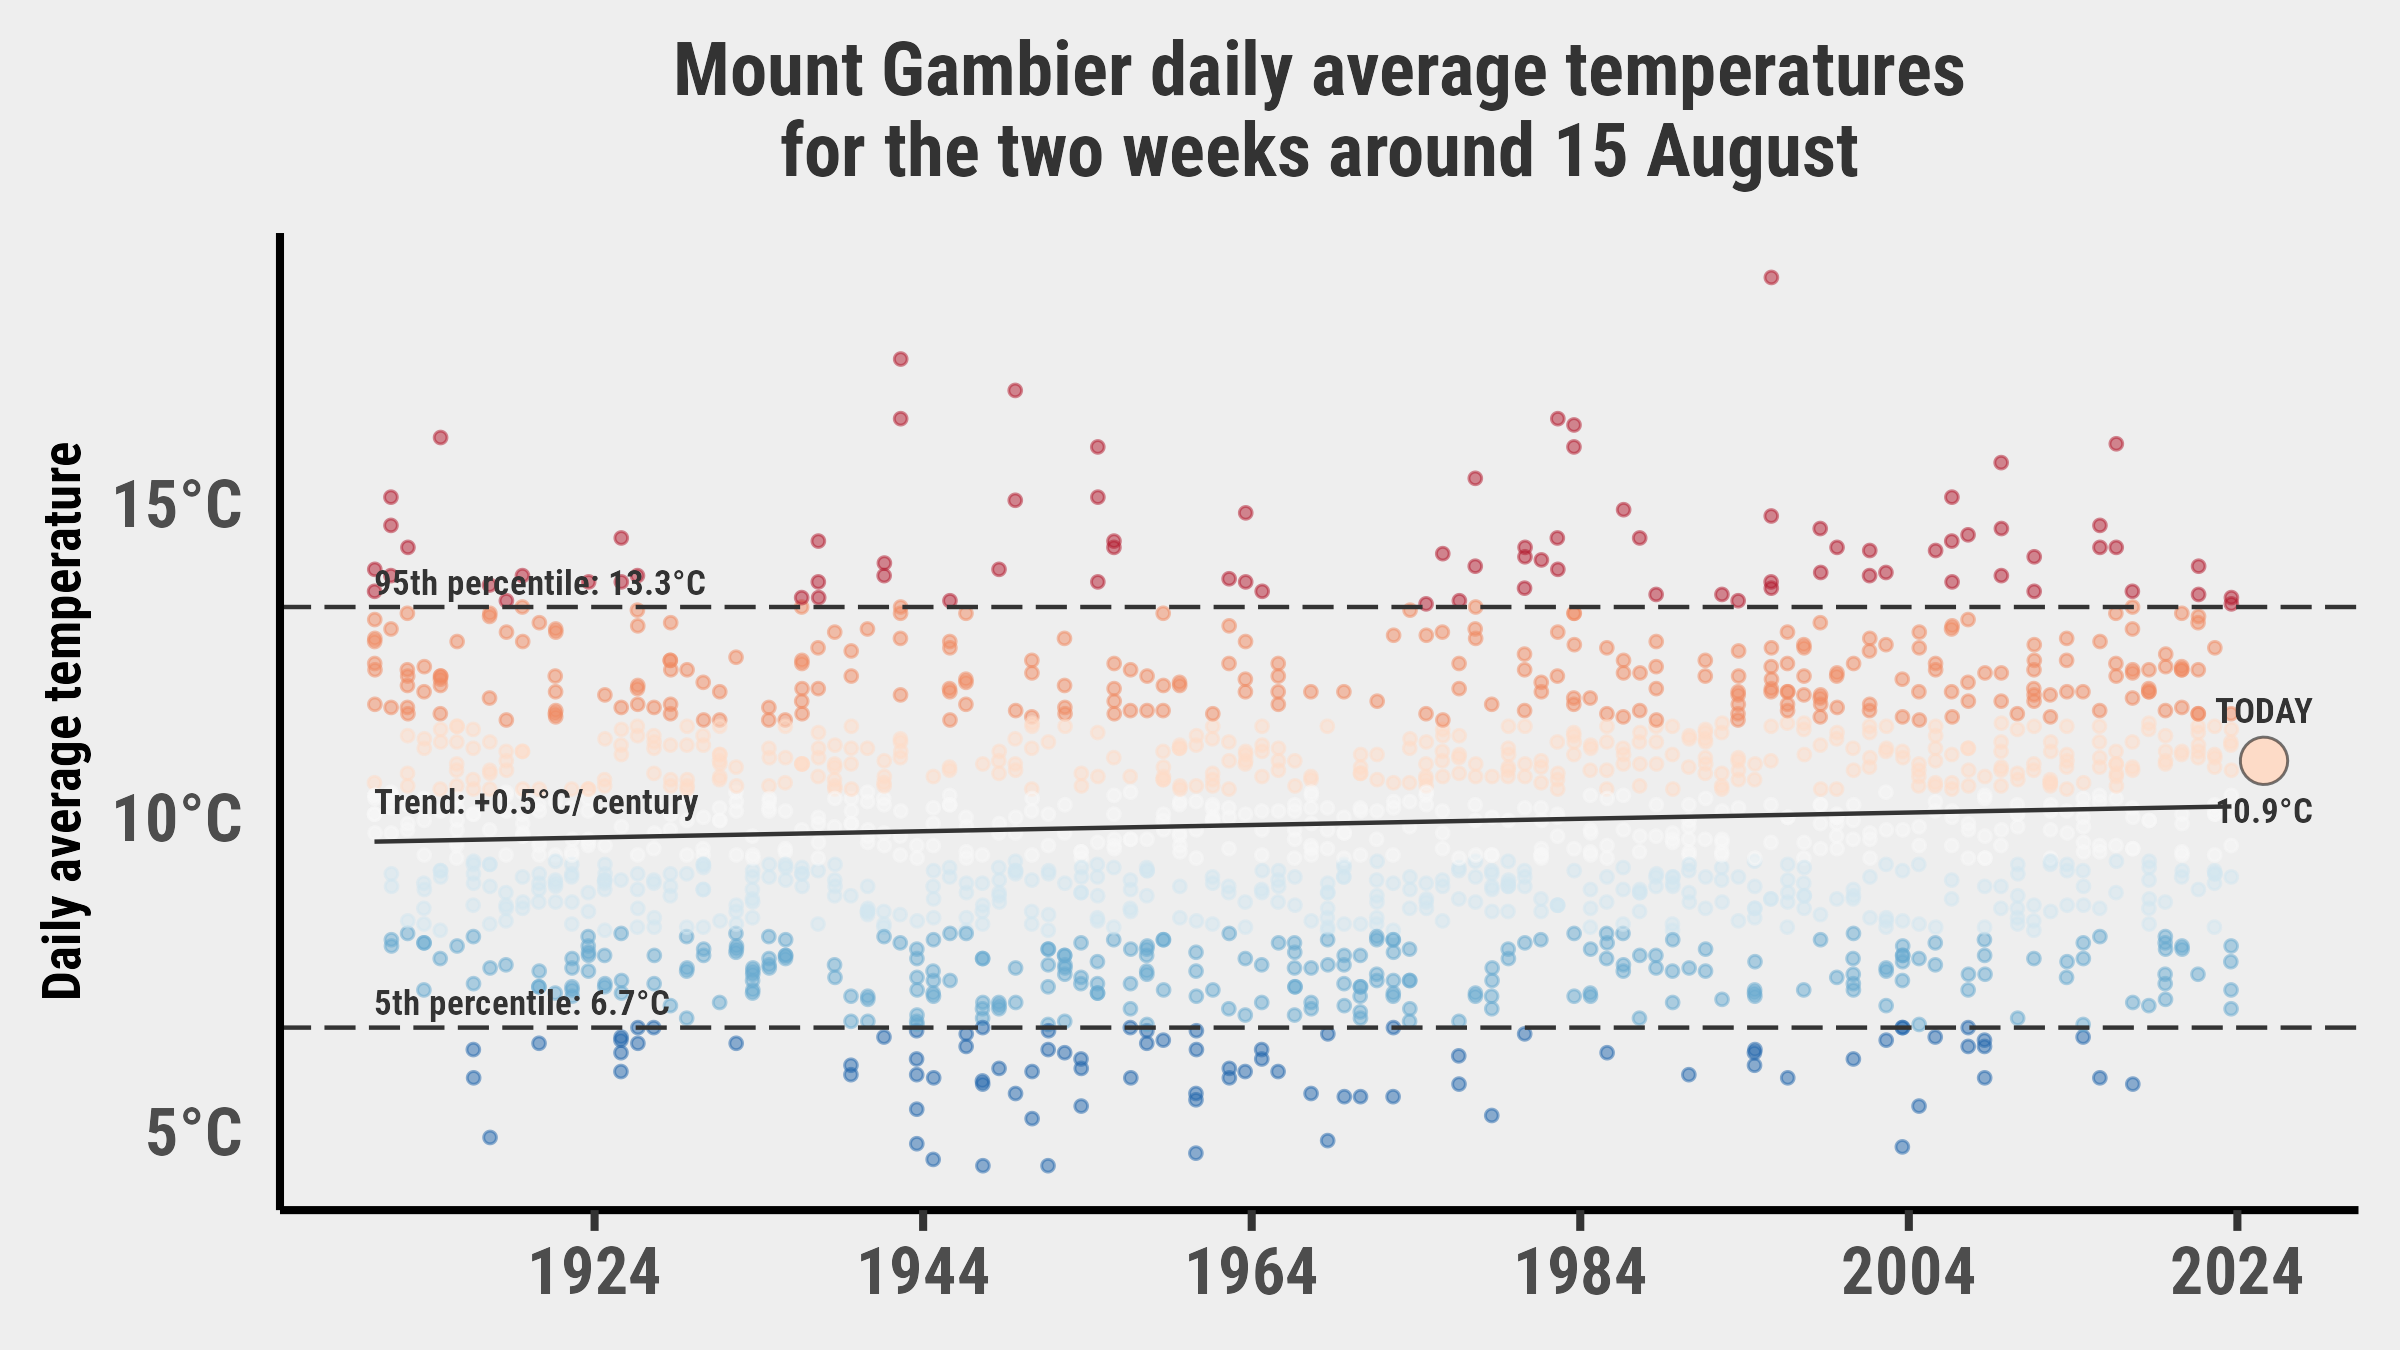
This is the distribution of temperatures typical for this time of year, which we’ve defined as a seven day window either side of today. Just like a bell curve, the plot is higher at more common temperatures and lower at rare temperatures.

We’ve compared every day this year at Mount Gambier to similar times of year in the past. Red days were hot compared to records; blue days were cold.

nowHour = (new Date()).getUTCHours()
nowHour >= 10 && nowHour <= 22 ?
  md`Some places may still be cooling off as the night continues.` :
md`Some places may still be heating up as the day continues.`Some places may still be cooling off as the night continues.
currentStats = statsAll.filter(d => (!d.max_stale) && (!d.min_stale))
staleStats = statsAll.filter(d => d.max_stale || d.min_stale)// breaking out the pointer layer for readability
// (and in case we decide to customise it later)
tipTemplate = Plot.pointer({
x: "lon",
y: "lat",
channels: {
place: {
label: "",
value: d => d.isit_label,
},
label: {
label: "",
value: d => d.isit_comment
},
separator: {
label: "",
value: d => ""
},
isit_maximum: {
label: "Max:",
value: d => d.isit_maximum + "°C"
},
isit_minimum: {
label: "Min:",
value: d => d.isit_minimum + "°C"
}
},
fontSize: 20,
fontFamily: "Roboto Condensed",
format: {
x: null,
y: null
},
lineWidth: 20,
lineHeight: 1.25,
pointerSize: 0,
fillOpacity: 0.8,
strokeOpacity: 0
}) Spain
Spain UK
UK Bochum
 Germany